


Aperçu
Surveillez les opérations Web avec l’assistance de l'IA pour obtenir des informations complètes sur votre site Web.
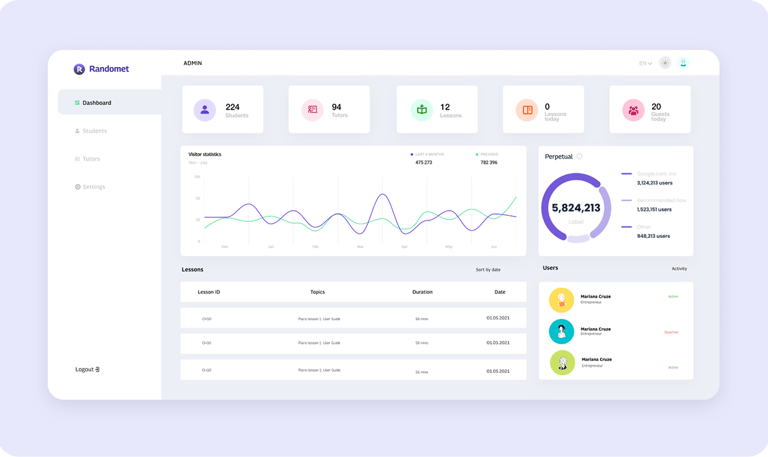
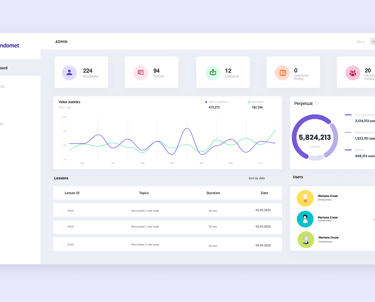
Une vue à 360 degrés
Bénéficiez d'une vue d'ensemble complète des performances et du fonctionnement de votre site web. Centralisez toutes vos informations, sans avoir à ouvrir Google Analytics, l'outil de test d'intrusion ou d'autres logiciels.
Notre tableau de bord vous offre un aperçu immédiat de ce que vous devez savoir et des points à améliorer.
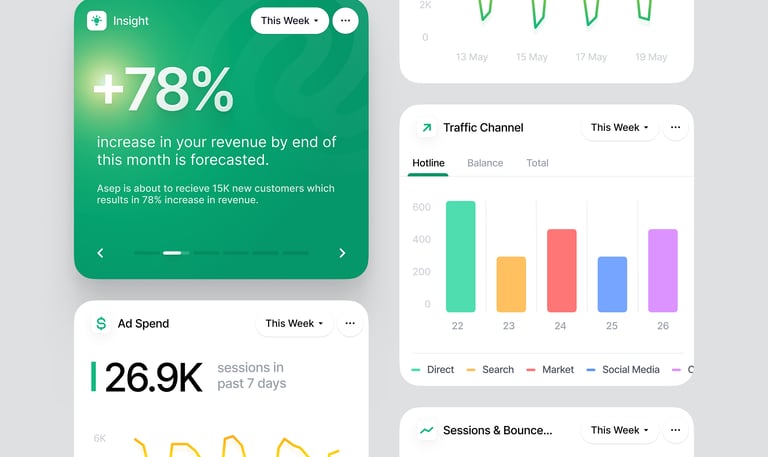
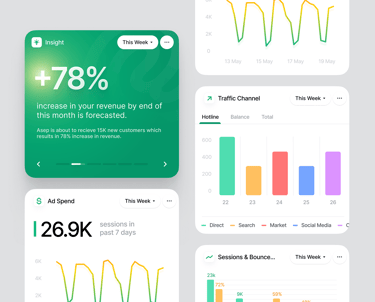
Informations sur les performances
Utilisez des outils d'IA avancés pour analyser et optimiser les performances de votre site web. Notre application fournit des informations exploitables pour améliorer l'expérience utilisateur et l'efficacité opérationnelle sur tous les aspects du web.


Outil de surveillance Web
Application basée sur l'IA pour des solutions complètes de surveillance des performances des sites Web.
Compréhension des performances
Obtenez des informations à 360 degrés sur les performances opérationnelles de votre site Web.
Alertes en temps réel
Recevez des notifications instantanées pour tout problème critique détecté sur votre site Web.
Ser3bellum a transformé nos opérations web grâce à ses analyses basées sur l'IA et à ses capacités de surveillance complètes. Je recommande vivement !
Marc Ranson


★★★★★
SITE MAP
Home
Tableau de bord
Analytiques
A propos
Démo
Politique de confidentialité
Termes et Conditions
CONTACT
newsletter
info@ser3bellum.com
ADDRESS:
6, Rue des Bateliers, Bureau 3, 92110 Clichy
©Ser3bellum 2025. All rights reserved. Registration number: 48141732700063.
Follow US